Comparative research of web applications frameworks' performance
Masters Dissertation at Poznan University of Technology.
Jurek Muszyński, October 2022
This article is a short, redacted version of the paper.
Goal
Web applications' frameworks differ in performance. There are some rankings available but they usually use very simple model, without user sessions.
This research tries to simulate the typical use case of a web application with user sessions. The number of connections and sessions in the test should be sufficient to expose potential inefficiencies in handling both lists by the framework or its server engine.
Tested frameworks include the three popular ones: Spring Boot, Node.js, Flask and Node++.
Background
Operating System
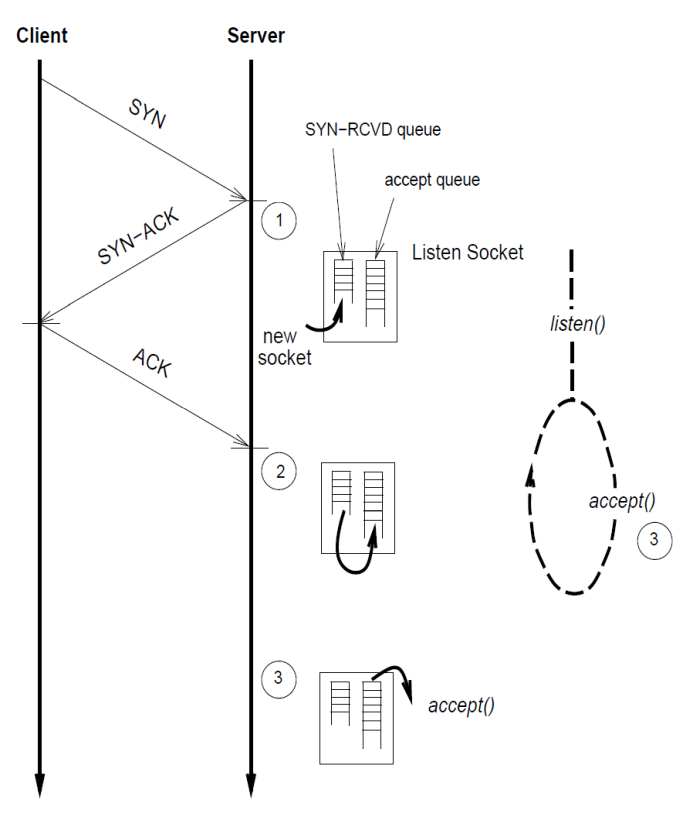
On the operating system level the basic role is played by the TCP protocol. The connection is established in a three-step way:

Source: [7]
The listening server uses one of the TCP ports. Incoming connection starts with a SYN packet sent by a client (1). If the server is free, it sends a SYN-ACK response, creates a new socket and puts it in the SYN-RCVD queue. After receiving an ACK packet from the client (2) connection is moved from SYN-RCVD queue to accept-ready. On the application level it's detected via listen() system call. accept() is used to actually accept the connection (3).
The waiting connection's queue size is set with somaxconn system variable. If the queue is full then incoming SYN packets are rejected.
The second parameter influencing potential queue saturation is tcp_keepinit, which sets the waiting time for ACK packet. On the one hand, it can't be shorter than a full round-trip, on the other, too high increases SYN-Flood vulnerability.
Application Layer
From the performance's perspective these are the top three factors: connections handling, sessions handling and application code execution.
Connections handling
The most popular models include:
- Single-threaded server, each client starts new process.
- Multi-threaded server, each client starts new thread.
- Multi-threaded server with worker threads pool.
- Asynchronous single-threaded server.
- Asynchronous multi-threaded server.
Asynchronous models require some kind of active connections' polling. There are three system calls for this: select(), poll() and epoll(). Each of them requires slightly different approach and they differ in potential and real performance (depending on server implementation). epoll() is not available on some systems.
Sessions handling
In single-instance applications sessions handling is basically about sorting and searching. There are three main models: unsorted collection (sequentuential search), sorted array (binary search) and hash table. Optimal model may depend on the expected number of sessions.
Application code execution
Three possibilities exist here and they significantly differ in terms of performance:
- Application code is part of the server code.
- Application code is run as a separate process (i.e. cgi).
- Application code is run in a different worker thread or process (RPC).
Web Application Model
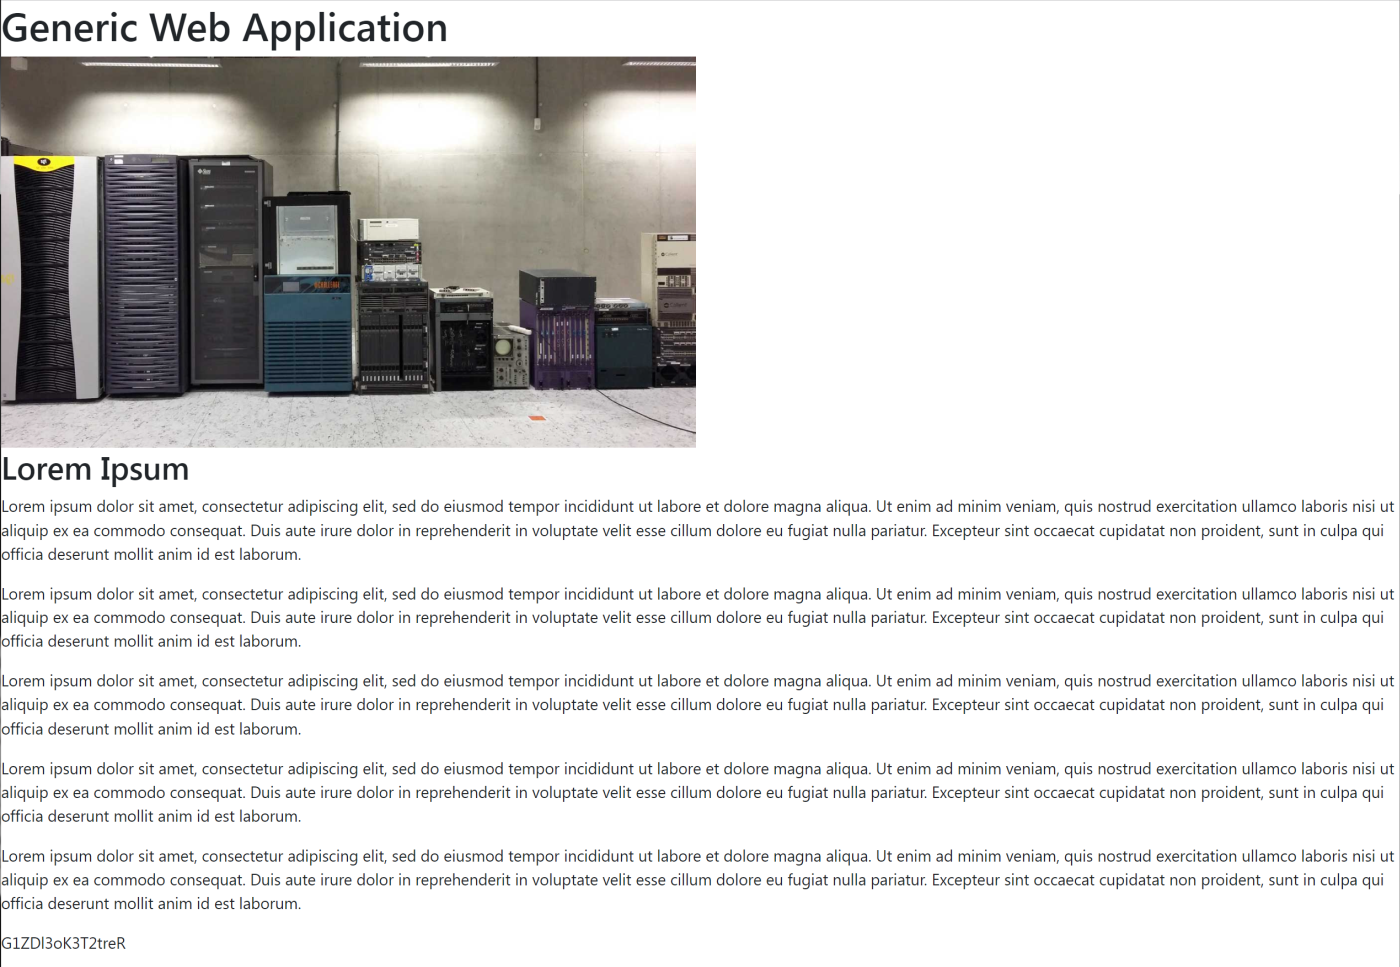
The application model used in the test consists of two HTML pages.
The first one (main) contains several KiB of text, ~100 KiB picture and a paragraph showing current session ID. There is also a ~200 KiB CSS file referenced in the header:

The second page is only an upload confirmation saying Data accepted.
Applications
All frameworks have been used with their default settings, except of Flask, where Waitress has been used instead of default development server.
The snippets below show the main request handling part for each framework:
Spring Boot
Node.js
Flask
Instead of default built-in HTTP 1.0 server (Werkzeug), production grade Waitress has been used.
Node++
Client
The client program has been written specifically for this research to allow maximum flexibility.
It's a command line tool sending batches of series of HTTP requests. Its priorities were to ensure maximum performance and to emulate browser traffic as close as possible.
Options:
Each batch starts a separate process. Each process sends r requests.
Important features of this program include:
- ability to parse HTML page to request static resources
- sending back session cookies
- ability to simulate intermittent user sessions with random number of requests per session (with average = 100)
- option for upload test, sending 15 KiB payload as a POST request
Randomly disconnecting allows to test server's ability to handle sessions' list search in a typical situation, that is – when newly connected client produces a valid session cookie.
Static resources are requested only once per session.
-f option allows to skip uncompressing and parsing of the response and instead request fixed list of static resources.
-u option adds an extra POST request with 15 KiB payload to all of the above.
The result is presented as a number of requests successfully executed (status 200 was received) during the time passed between the first and the last request:
Test Environment
Local Area Network has been used with 11 computers connected through 1 Gbps Ethernet.
Hardware and system: Intel i7-8700 @ 3.2 GHz / 16 GiB RAM / Ubuntu 18.04.
Test Procedure
One of the computers hosted the application and the remaining 10 were used to run the clients.
Each application has been tested after fresh restart. Before running test there was a visual verification in the browser that application works as expected.
On each of the client machines there was a script waiting for a flag copied from the master so the test would start simultaneously on all of them.
Read
The following options have been used on the client computers:
10 batches on 10 computers resulted in maximum 100 connections and 100 sessions at the same time. Each batch sent 10,000 requests, so the total number of requests per test run was 1 million. Connections have been randomly disconnected to simulate real user traffic, as described in Client section.
Write
Upload test client options:
Average
For each test run both extremes have been removed from the results and the average was calculated using the remaining 8.
Results
Spring Boot
Read
Total average = 21,139 rps
Write
Total average = 14,129 rps
As we can see, one of the client processes shows a connection error. Repeating did not help. The test however was accepted, as this kind of error is relatively easy to handle.
Node.js
Read
Total average = 10,776 rps
Write
Total average = 9,380 rps
Flask
Read
Total average = 1,170 rps
Write
Total average = 1,620 rps
Node++
Read
Total average = 50,026 rps
Write
Total average = 14,740 rps
Results Summary
Thousands of requests per second:
| Test | Spring Boot | Node.js | Flask | Node++ |
|---|---|---|---|---|
| Read | 21.1 | 10.8 | 1.2 | 50.0 |
| Write | 14.1 | 9.4 | 1.6 | 14.7 |
Summary
As expected, compiled technologies turned out to be better performing than interpreted ones. It's particularly visible in the case of Flask, where response rendering time in the read test surpassed upload time in the write test, despite more data being transmitted in the latter case.
Bibliography
- Max Roser, Hannah Ritchie, Esteban Ortiz-Ospina, Internet, Our World in Data, 2015 (https://ourworldindata.org/internet, access 2022-06-25)
- Shailesh Kumar Shivakumar, Modern Web Performance Optimization, Apress, 2020
- Raj Jain, The Art of Computer Systems Performance Analysis, Wiley & Sons, 1991
- Brendan Gregg, Systems Performance: Enterprise and the Cloud (Addison-Wesley Professional Computing Series), Pearson, 2021
- TechEmpower, Web Framework Benchmarks (https://www.techempower.com/benchmarks, access 2022-06-25)
- Dan Kegel, The C10K problem (http://www.kegel.com/c10k.html, access 2022-06-25)
- Gaurav Banga, Peter Druschel, Measuring the Capacity of a Web Server, Department of Computer Science, Rice University, 1997
Is something wrong here? Please, let us know! 